spring-ai-playground
title: MCP Inspector Observability description: MCP primitive observability - counts and times the protocol operations beneath tool calls: tools, resources, prompts, sampling, elicitation, and roots.
MCP Inspector
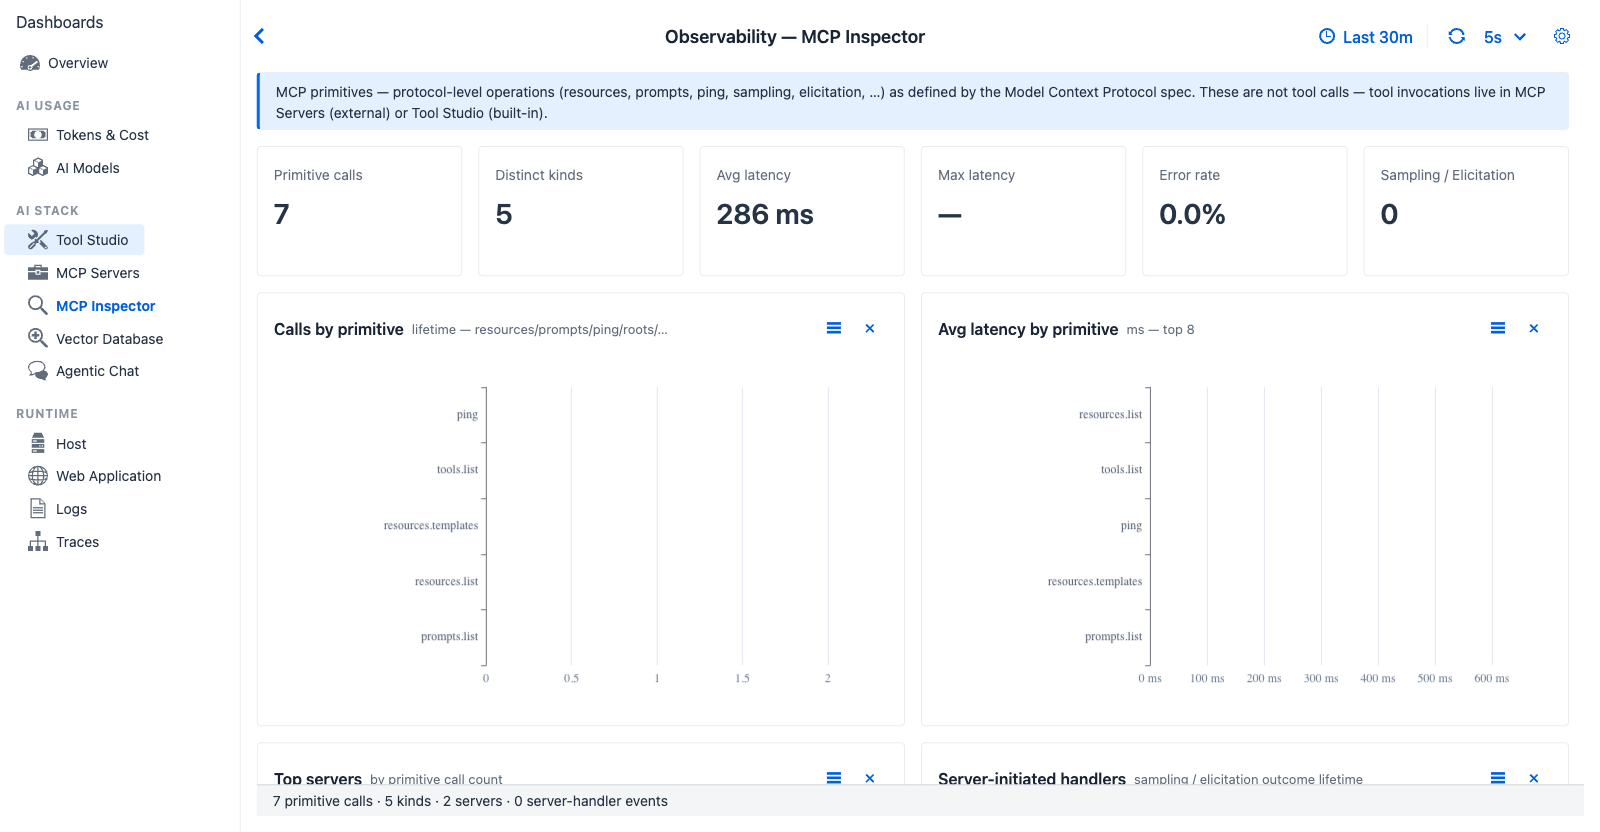
MCP Inspector - populates as soon as a tools.list, resources.read, prompts.get, or sampling / elicitation exchange happens against any registered server.
Purpose - MCP primitive observability. MCP defines a small protocol surface beyond tool calls: list/read tools, list/read resources, get prompts, sampling, elicitation, roots. This tab counts and times those operations, separately from the tool-call traffic in the MCP Servers tab.
When to look here
- “Is the agent re-listing tools too often?” - Calls by primitive (high
tools.list→ wasteful). - “Is a server’s resource read slow?” - Avg latency by primitive.
- “Which server is handling server-initiated sampling / elicitation requests?” - Server-initiated handlers chart.
- “Is the inspector itself errored?” - Error rate KPI.
Controls
All dashboards share the Observability global settings - time window, refresh interval, custom range. MCP Inspector has no tab-specific controls beyond those.
KPI cards (six)
| Card | Shows | Source |
|---|---|---|
| Primitive calls | Total non-tool MCP primitive operations | MCP primitive observations |
| Distinct kinds | Number of unique primitive kinds invoked (tools.list, resources.read, …) | set(mcp.primitive) size |
| Avg latency | Mean primitive operation duration | Duration distribution |
| Max latency | Slowest single primitive call | Max of durations |
| Error rate | Percentage of primitive calls with status=ERROR |
Status field |
| Sampling / Elicitation | Count of server-initiated requests in the window | Two specific MCP primitives |
Charts (four)
| Chart | Type | Reading |
|---|---|---|
| Calls by primitive | Horizontal bar by primitive kind | Identifies primitives the agent uses most |
| Avg latency by primitive | Horizontal bar (ms) | Slow primitives - e.g. resources.read against a large resource |
| Top servers | Horizontal bar by call count | Which MCP server fields the most primitive traffic |
| Server-initiated handlers | Bar (sampling vs elicitation) | If a server requests sampling and the client never responds, it shows here |
Cross-references
- MCP Server → MCP Inspector (feature) - the user-facing UI for browsing primitives (this dashboard observes that UI’s traffic)
- Tutorial 9 - MCP Everything walkthrough - hands-on tour of all eight MCP primitives
- MCP Servers - sibling tab for tool-call traffic