spring-ai-playground
title: Tool Studio Observability description: In-process tool execution observability - JS sandbox and local @Tool methods, latency p50/p95/p99, error rate, and sandbox guard-block counts.
Tool Studio
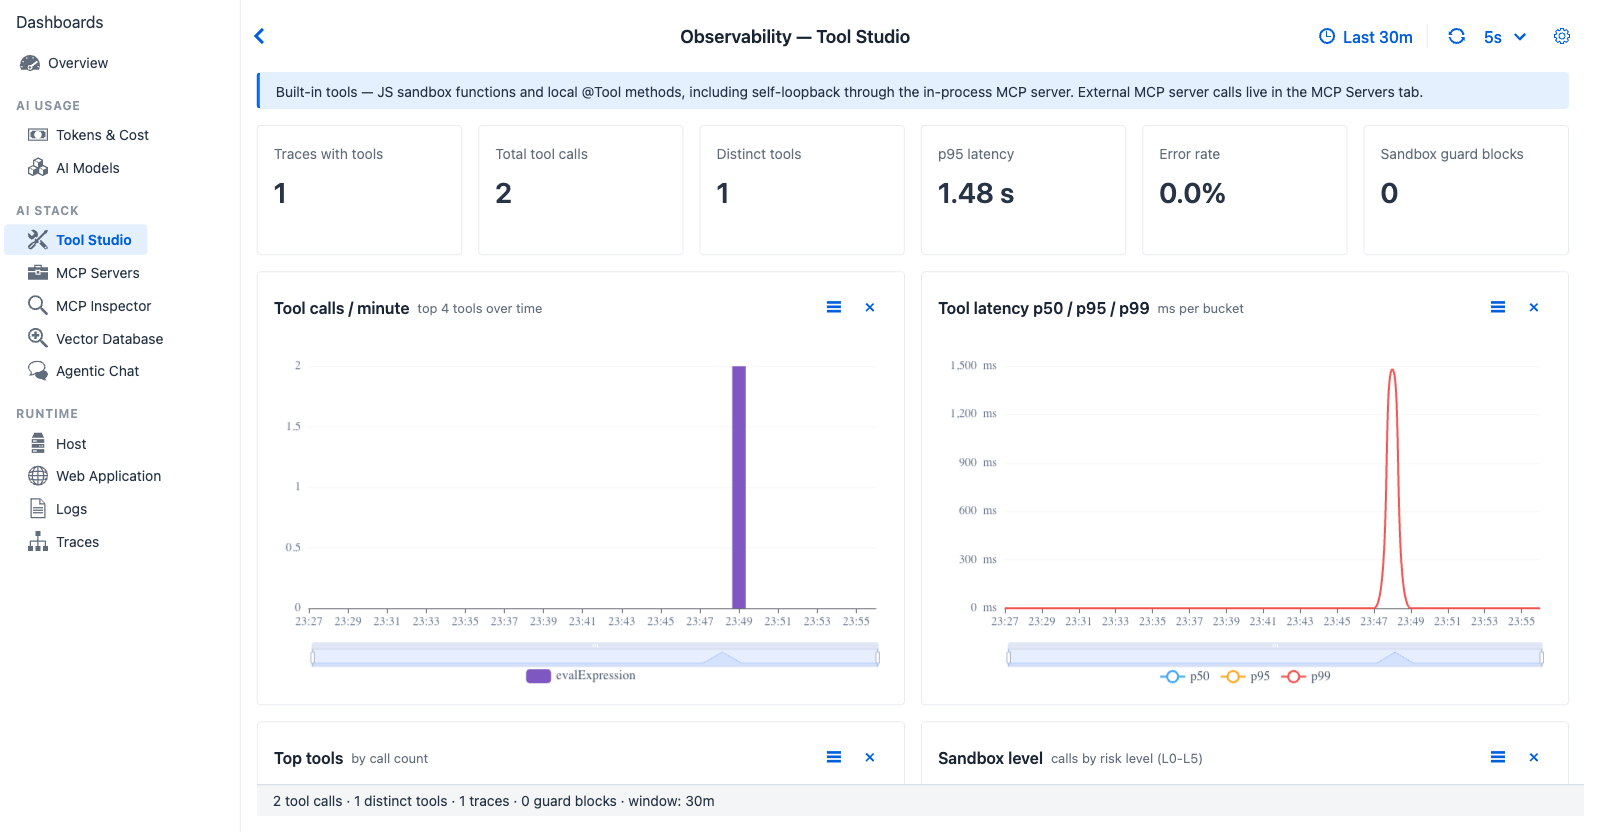
Tool Studio - counts in-process Spring AI tool callbacks. When chat traffic routes through the built-in MCP server (the default exposure path), tool spans carry network.transport=tcp and surface in MCP Servers instead - so a busy chat session can still show 0 here. The Sandbox guard blocks KPI ties this dashboard to the prevention layer in Safety Architecture regardless of where the tool was routed.
Purpose - observe in-process tool execution: the JS-sandbox tools authored in Tool Studio, every Spring AI @Tool method, anything the agent calls without leaving the JVM. Cross-references the sandbox prevention layer through the sandbox.guard.blocked counter.
When to look here
- “Did the agent’s tool selection finally trigger the expected
searchWikipediacall?” - Top tools horizontal bar. - “Why is my own in-process tool slow?” - Tool latency p50 / p95 / p99.
- “How often is the sandbox actually blocking unsafe actions?” - Sandbox guard blocks counter + chart (zero is healthy; sustained non-zero means agent is repeatedly trying something the sandbox denies).
- “What Risk Level posture is the running tool catalog?” - Sandbox level histogram (L0 / L3 / L4 / L5 distribution).
- “Are tools failing more than they used to?” - Error rate KPI + the Tool calls / minute trend line.
Span filter
spring.ai.tool spans where mcp.method.name is absent (in-process).
Controls
All dashboards share the Observability global settings - time window, refresh interval, custom range. Tool Studio has no tab-specific controls beyond those.
KPI cards (six)
| Card | Shows | Source |
|---|---|---|
| Traces with tools | Number of chat turns that called at least one in-process tool | TraceRecord where any child span is spring.ai.tool without mcp.method.name |
| Total tool calls | Count of all in-process tool spans | Sum of qualifying spans |
| Distinct tools | Number of unique tool names called | set(spring.ai.tool.definition.name) size |
| p95 latency | 95th-percentile in-process tool duration | Span duration distribution |
| Error rate | Percentage of tool spans with status ERROR |
Span status |
| Sandbox guard blocks | Cumulative sandbox.guard.blocked counter |
MeterRegistry counter incremented by the sandbox at each block |
The Sandbox guard blocks KPI is the concrete bridge to the Safety layer. See Safety Architecture → AI Agent Tool Safety for what triggers a block and Observability Architecture → Foundation for behavioural controls for how this counter ties Sandbox prevention to Observability visibility.
Charts (five)
| Chart | Type | Reading |
|---|---|---|
| Tool calls / minute | Stacked bar (top 4 tools), in-process spans/min | Spike → agent in a tool-heavy phase; sustained zero with chat traffic → tools not being selected (check Top tools below) |
| Tool latency p50 / p95 / p99 | Multi-line, ms | Diverging p99 from p50 → tail-latency regression in one tool |
| Top tools | Horizontal bar (top 8 by call count) | The most-called tool head; helps spot accidental tool selection |
| Sandbox level | Histogram across L0 / L3 / L4 / L5 by call | L0 = safest baseline; high L5 traffic warrants per-tool review |
| Sandbox guard blocks | Horizontal bar (lifetime), by category / reason |
Cluster of blocks → agent attempting forbidden action repeatedly (e.g. SSRF probe) |
Cross-references
- Safety Architecture - sandbox layers, Risk Level, what triggers a guard block
- Tool Studio (feature) - how in-process tools are authored
- MCP Servers - sibling tab for the same shape of data, externally routed
- Observability Architecture → Tool and MCP observability -
McpToolObservationFilterinjection mechanism