spring-ai-playground
title: AI Models description: Model and provider behaviour - latency distribution, throughput, streaming TTFT and per-chunk timings, embedding and image generation durations.
AI Models
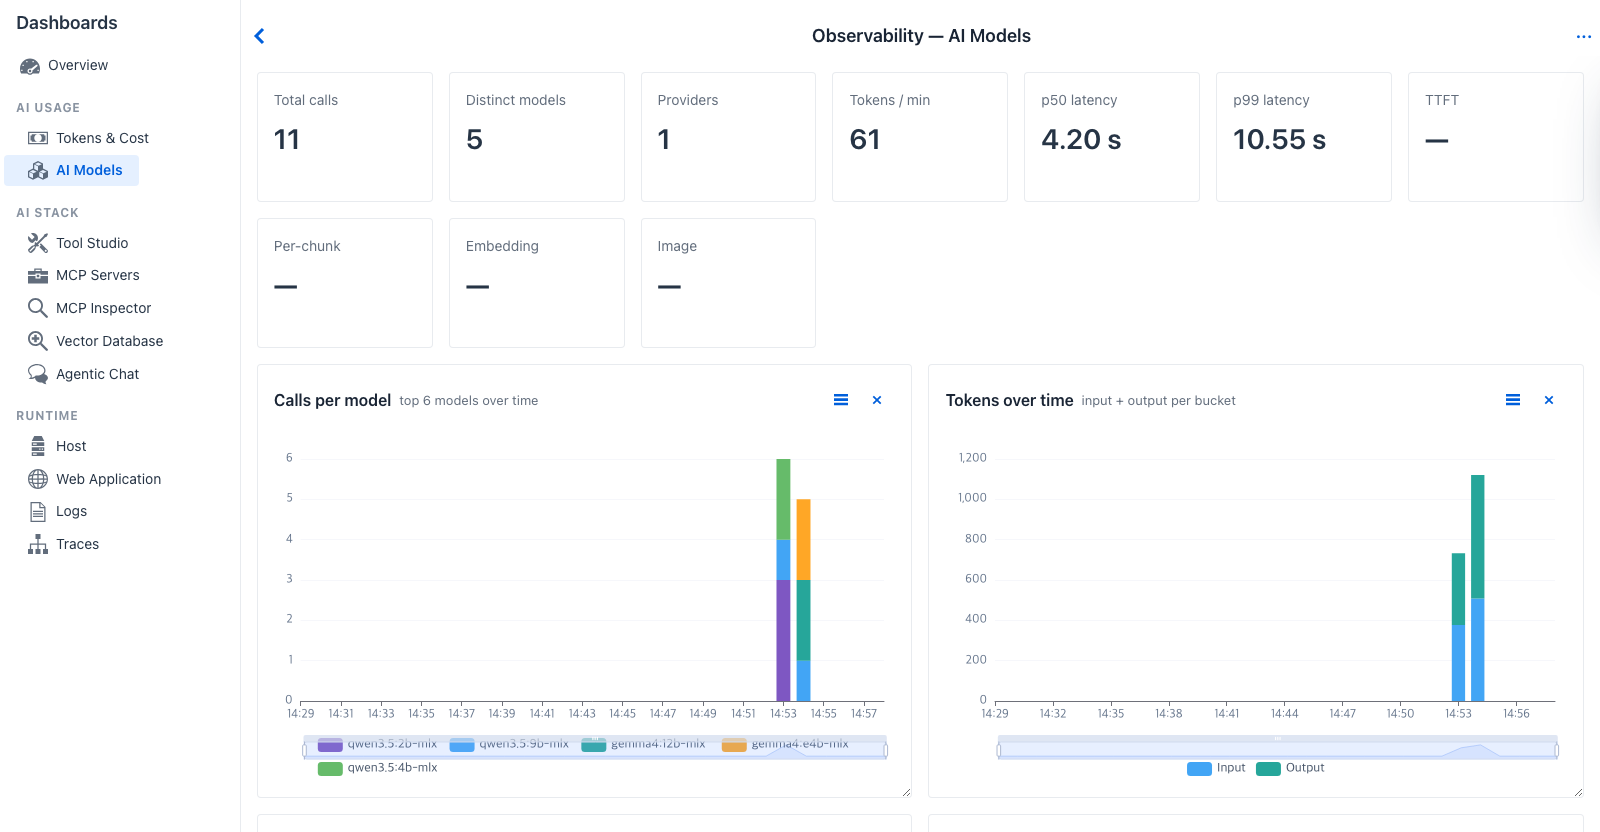
AI Models - call and token volumes broken out per model and per provider. The streaming-aware KPIs (TTFT and Per-chunk) are populated by Spring AI’s streaming observation timers when the chat client streams chunks.
Purpose - break down model and provider behaviour: latency distribution, throughput, and the streaming-specific timings that token-only views miss (Time to First Token, per-chunk latency). Also covers embedding and image generation timings, which use different Spring AI observations.
When to look here
- “Why does this model feel sluggish?” - TTFT + Per-chunk surface streaming latency that p50 / p99 averages can hide.
- “Did the provider quietly route us to a different model?” - Calls per model and Tokens per model catch model drift.
- “Is the agent calling outside our intended provider?” - Provider mix donut.
- “How many distinct providers and models are in active use?” - Distinct models and Providers KPI counts.
Controls
All dashboards share the Observability global settings - time window, refresh interval, custom range. AI Models has no tab-specific controls beyond those.
KPI cards (ten)
| Card | Shows | Source |
|---|---|---|
| Total calls | Trace count in the window | TraceRecord count |
| Distinct models | Number of unique models seen | set(TraceRecord.model) size |
| Providers | Number of unique provider systems | set(gen_ai.system) size |
| Tokens / min | Throughput | Total tokens ÷ window minutes |
| p50 latency | 50th-percentile turn duration | ObservabilityTimeSeries.compute().overallP50LatencyMs |
| p99 latency | 99th-percentile turn duration | overallP99LatencyMs |
| TTFT | Time To First Token - mean and max | Spring AI streaming observation timer (gen_ai.client.operation.time_to_first_chunk) read directly from MeterRegistry |
| Per-chunk | Mean and max per-chunk latency for streaming responses | Spring AI streaming chunk observation timer |
| Embedding | Mean and max embedding model call duration | EmbeddingModelObservationContext-derived timer |
| Image | Mean and max image generation call duration | ImageModelObservationContext-derived timer |
Charts (five)
| Chart | Type | Reading |
|---|---|---|
| Calls per model | Stacked bar over time | Sudden new model line appearing → model drift; sustained flat line on one model → stable workload |
| Tokens over time | Line, total tokens per minute | Useful complement to call rate when calls are few but token-heavy |
| Tokens per model | Horizontal bar, top 8 by total tokens | Identifies the model carrying most of the token volume |
| Provider mix | Donut, by call count | Should match deployment intent (one provider = single-backend; multiple = mixed routing) |
| Provider HTTP requests by host | Horizontal bar, from http.client.requests metric |
Sees outbound provider traffic at the HTTP layer - distinct from gen_ai.* span counts because HTTP includes embedding, image, etc. |
Drilldowns
This tab does not surface a per-trace grid - for raw traces drill into Traces. For per-conversation aggregates drill into Agentic Chat.
Cross-references
- Overview → LLM section - the request rate, latency, provider mix, and top models charts on Overview drill into this tab.
- Observability Architecture → What gets captured - the
gen_ai.client.operationspan and its attributes (gen_ai.system,gen_ai.response.model,gen_ai.usage.{input,output,total}_tokens,gen_ai.response.finish_reasons). - Tokens & Cost - sibling tab that converts the same per-model rollups into money.