spring-ai-playground
title: Tokens & Cost description: Token and money spend per turn, model, and provider, with the Model Pricing Manager for per-model rates, display currency, and paid-vs-free interpretation.
Tokens & Cost
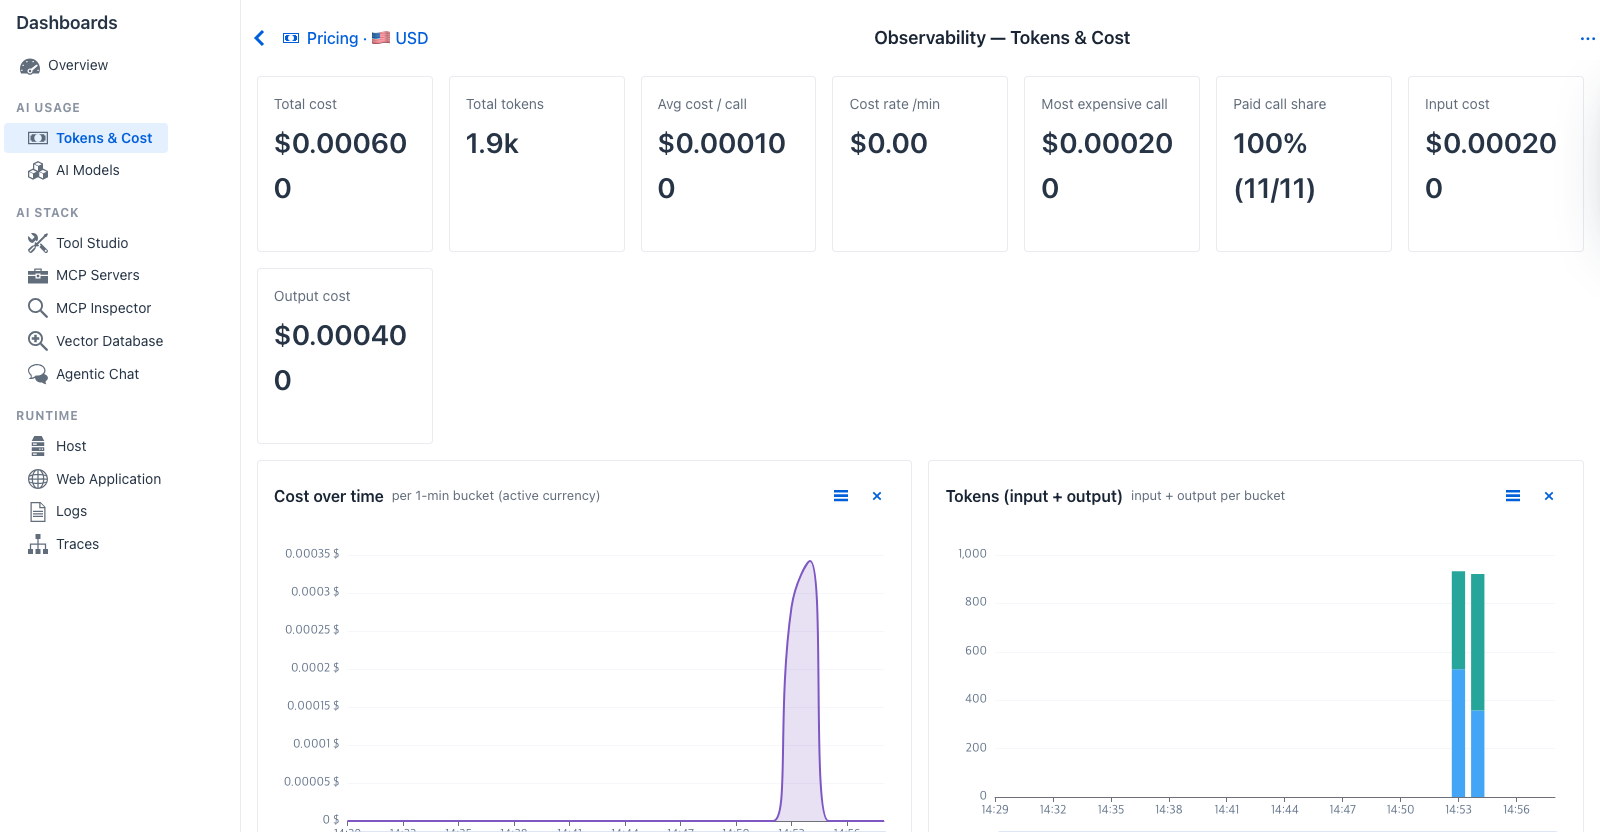
Tokens & Cost - when no per-model pricing has been configured (warning chip top-left), the Cost panels show $0 across the board while the token-volume panels still surface model and provider mix. Each chat turn appears as a vertical bar on the Tokens (input + output) chart.
Purpose - track token spend and money spend per turn, per model, per provider. Answer “is this model worth what it costs” and “are we trending over budget.”
When to look here
- “Did my conversation cross a dollar budget?” - Total cost + Cost rate /min give a rolling burn rate.
- “Which model is dominating cost?” - Cost by model horizontal bar (top 8) makes the heaviest spender obvious.
- “Am I sending too much input vs output?” - Input cost vs Output cost split surfaces over-stuffed contexts.
- “Was that one outlier turn a runaway?” - Most expensive call + the Top-10 expensive traces grid catch isolated spikes.
- “What share of my traffic is free vs paid?” - Paid call share (e.g.
0/5→ all local-model traffic).
Controls
All dashboards share the Observability global settings - time window, refresh interval, custom range. Tokens & Cost adds one tab-specific control:
- Pricing chip at the top - opens the Model Pricing Manager dialog where you set per-model rates and switch the active display currency. See the dedicated section below.
KPI cards (eight)
| Card | Shows | Source |
|---|---|---|
| Total cost | Sum of cost across the window in the active currency | ModelPricingService.cost(model, input, output) summed across TraceRecords, then converted by CurrencyService |
| Total tokens | Sum of input + output tokens | TraceRecord.totalTokens (falls back to inputTokens + outputTokens when total is null) |
| Avg cost / call | Total cost ÷ trace count in window | Derived |
| Cost rate /min | Total cost ÷ window minutes | Derived |
| Most expensive call | Maximum cost of a single trace | max(cost) over the window |
| Paid call share | Calls whose model has a pricing entry over total - e.g. 0% (0/5) when all traffic is local Ollama |
Comparison against configured pricing entries |
| Input cost | Cost contribution from input tokens only | inputTokens × inputPerMillionTokens summed |
| Output cost | Cost contribution from output tokens only | outputTokens × outputPerMillionTokens summed |
Charts (five)
| Chart | Type | Reading |
|---|---|---|
| Cost over time | Area, per-minute, active currency | Sustained climb during quiet hours hints at scheduled paid workloads; flat line under all-local models confirms zero-cost operation |
| Tokens (input + output) | Stacked bar, 2-series per bucket | One bar per turn - input dwarfing output is expected for tool-using prompts |
| Cost by provider | Donut, active currency, top 6 providers | Single-color donut (one provider) confirms the conversation never spilled to a second backend |
| Cost by model | Horizontal bar, top 8 by cost, active currency | When pricing is missing, the bar still renders by traffic; it is the same shape as Tokens by model below - a hint that pricing should be configured |
| Tokens by model | Horizontal bar, top 8 by total tokens | Independent of pricing - always shows model traffic |
Tables
Per-model breakdown grid - Model · Calls · In tok · Out tok · Cost · Avg / call. Sortable by any column. When pricing has not been configured the Cost column still shows, reading $0.00 for unpriced models.
Top 10 most expensive traces - Time · Model · In · Out · Cost · Trace. Each row is the click-through to the Trace Detail dialog for that single turn. Useful when one outlier dragged the average up.
Configuring cost - Model Pricing Manager dialog
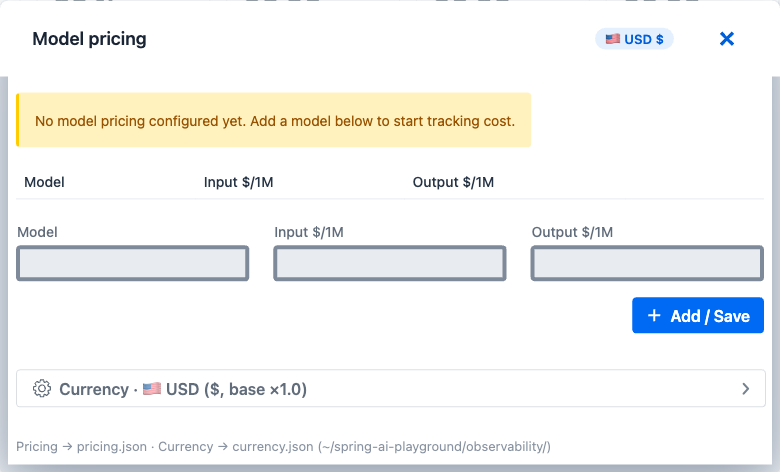
Model Pricing Manager dialog - the single UI surface for configuring per-model rates and display currency. Two sections: per-model pricing editor (top) and currency selector (bottom). All edits persist automatically; there is no other supported way to configure cost.
How to open - click the Pricing chip at the top of this dashboard (Model pricing + display currency / exchange rate; reads ⚠ Pricing - none configured · 🇺🇸 USD when nothing is set).
What you can change
| Section | Contents |
|---|---|
| Active currency chip | Top-right USD $ (or other active currency). Click to expand the currency editor below. |
| Status banner | Yellow No model pricing configured yet when empty; hidden otherwise. |
| Existing rows | One row per pricing entry - Model · Input $/1M · Output $/1M · Delete |
| New row | Empty input row at the bottom for adding a model |
| + Add / Save | Persists the row (or all edits) in the background. The dashboard refreshes within seconds. |
| Currency section | Expandable - opens the active currency selector + base × rate display + per-currency editor for 40+ shipped currencies |
Adding a model rate
- Type the model identifier exactly as it appears in the AI Models dashboard (e.g.
gpt-4o-mini,claude-3-5-sonnet) - matching is exact-string, no patterns or aliases. - Enter Input $/1M - the USD rate per million input tokens (provider’s published rate).
- Enter Output $/1M - the USD rate per million output tokens.
- Click + Add / Save. The new row appears immediately and this dashboard recomputes within seconds.
Switching display currency
- In the dialog, click the Active currency chip (top-right) to expand the currency section.
- Pick a code from the dropdown (USD, EUR, KRW, JPY, and 40+ others).
- Click Save. Every dollar figure in the dashboards re-renders with the new symbol and the active per-USD rate.
Updating a currency’s exchange rate
The dialog’s per-currency editor lets you adjust the × rate value for any shipped currency. Defaults are reasonable starting points but not live - keep them current through the dialog.
Missing model handling
When a trace’s model field has no pricing entry, cost evaluates to zero, not an error. This is intentional: local / open-weight models (Ollama, llama.cpp, vLLM, …) flow through the dashboards without forcing a “$0” rate to be configured for them.
Persistence semantics
Saved edits become visible on the next dashboard refresh and survive restarts. Pricing and currency configuration are owned entirely by this dialog - there is no other supported way to change them.
How cost is computed
For every TraceRecord in the active window:
cost = inputPerMillionTokens × inputTokens / 1_000_000
     + outputPerMillionTokens × outputTokens / 1_000_000
BigDecimal, 6-decimal precision, HALF_UP rounding. The result is converted to the active currency only at render time - the TraceRecord itself stays in USD-neutral token counts. Trace records are pricing- and currency-neutral; changing pricing or currency does not rewrite history, it changes how history is interpreted on the next refresh.
Worked example
Configure gpt-4o-mini at OpenAI’s published rate (0.15 USD input / 0.60 USD output per 1M tokens), then run one chat turn that consumes 4 000 input tokens and 200 output tokens:
input cost  = 0.15 × 4000 / 1_000_000 = 0.0006 USD
output cost = 0.60 ×  200 / 1_000_000 = 0.00012 USD
total       = 0.00072 USD
What shows up where:
| Surface | Value |
|---|---|
| Total cost KPI | $0.00 (the underlying BigDecimal is 0.00072; the dashboard displays at 2-decimal precision) |
| Avg cost / call KPI | Same row, divided by 1 |
| Paid call share KPI | 100% (1/1) - gpt-4o-mini has a pricing entry |
Per-model breakdown grid → gpt-4o-mini row |
Calls 1 · In tok 4000 · Out tok 200 · Cost $0.00 · Avg / call $0.00 |
| Overview → Cost (USD) KPI | $0.00 |
Switch active currency to KRW (× 1340): every cost number above is multiplied by 1340 and the $ symbol is replaced with ₩. Trace records are unchanged.
Paid vs free interpretation
The Paid call share KPI is the operator-facing summary of who paid for traffic in this window:
paid share = (TraceRecords whose model has a pricing entry) / (total TraceRecords in window)
| Reading | Interpretation |
|---|---|
0% (0/N) |
All traffic was local / open-weight; no paid provider invocations |
100% (N/N) |
Every call hit a paid model - verify against budget |
| Mixed | Confirm whether the routing strategy intends mixed model use |
This is intentionally a count-based share, not a cost-based share - a single expensive paid call alongside many free calls still reads as 1/N, surfacing the mix as a count rather than as a dollar weight (the dollar weight is already visible on the cost KPIs).
Drilldowns
- Row click in the Top 10 most expensive grid → opens the Trace Detail dialog for that turn.
- Pricing chip → opens the Model Pricing Manager dialog.
- Currency selector in the pricing chip → opens the same dialog scrolled to the currency editor.
Cross-references
- Overview → Tokens & Cost section - the headline area chart and stacked bar on Overview drill into this tab.
- AI Models - sibling tab that slices the same spans by model identity instead of money.
- Agentic Chat → Avg cost / conv - conversation-level cost aggregation.
- Observability Architecture → Cost attribution - implementation reference (contributor-facing).