spring-ai-playground
title: Host description: Operational JVM and OS health - heap, GC, threads, CPU, load, uptime, disk, and file descriptors, fed by a metrics pipeline independent of trace traffic.
Host
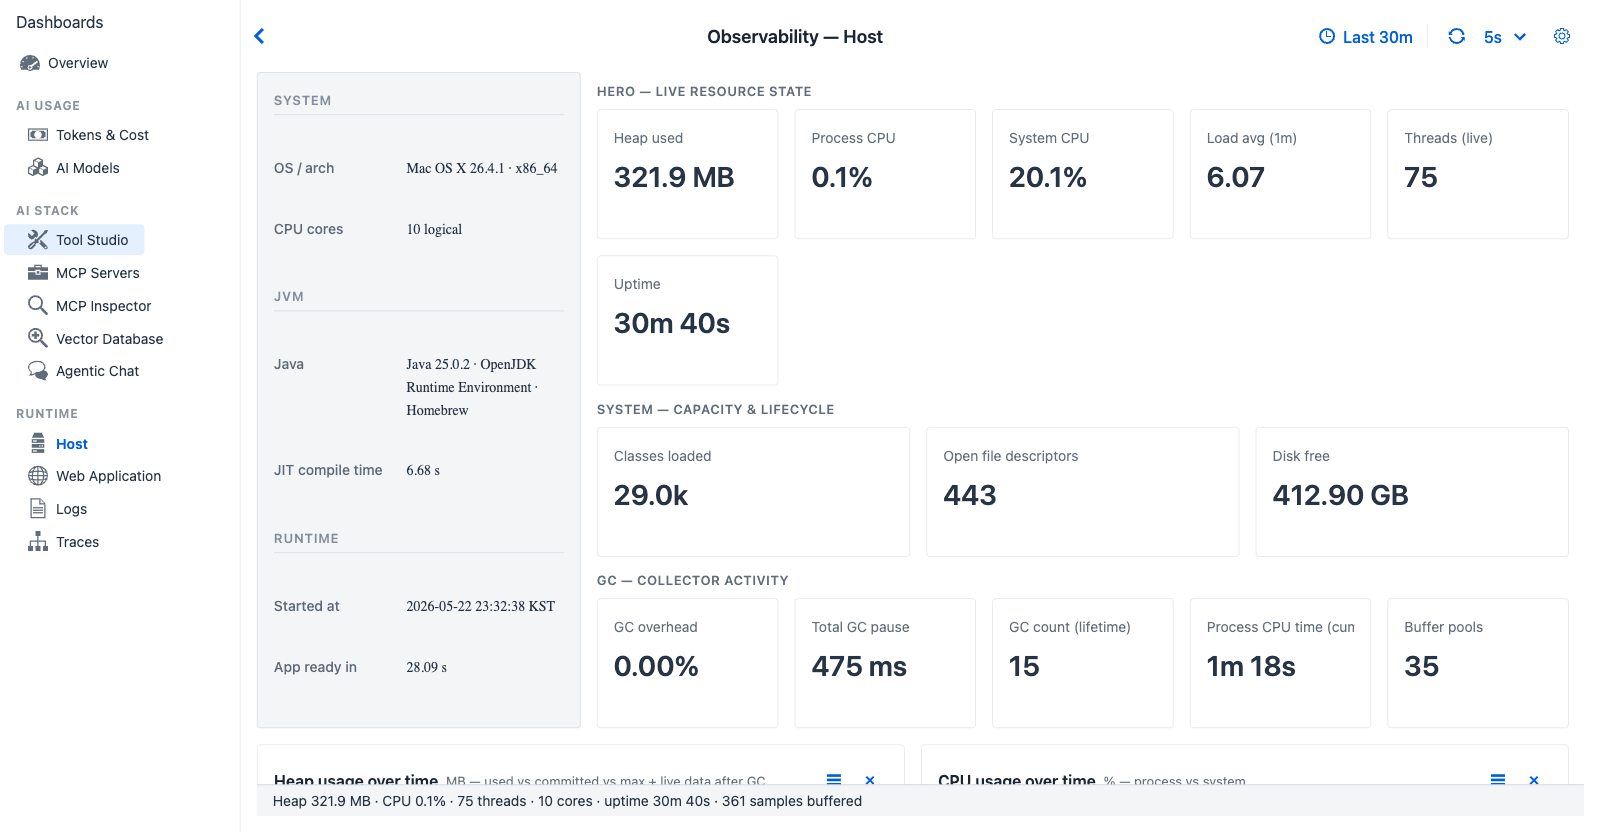
Host tab during an active chat session - fed by the parallel SystemMetricsCollector pipeline which samples MeterRegistry on a fixed cadence and retains rolling history independently of the trace ring buffer. Even quiet servers show live heap, GC, and thread movement.
Purpose - operational JVM and OS health. Independent of any trace activity - even a quiet server will show heap, GC, and CPU curves.
When to look here
- “Is there a memory leak?” - Heap usage over time (climbing without GC drops) + Heap retention after GC (% retained climbing).
- “Why is the app slow?” - Process CPU + System CPU + Threads by state.
- “Did the JVM hit a long pause?” - GC activity over time + Total GC pause KPI.
- “How long has this instance been up?” - Uptime KPI.
- “Am I running out of file descriptors?” - Open file descriptors KPI.
- “Is disk filling up?” - Disk free KPI.
- “Are buffer pools healthy (Direct / Mapped)?” - Buffer pool used vs capacity.
Data source
SystemMetricsCollector samples Spring Boot Actuator MeterRegistry on a scheduled cadence; SystemMetricsRingBuffer stores the snapshots; SystemMetricsTimeSeries derives the charts. Does not flow through the trace pipeline, so noisy chat activity cannot crowd out system metric history.
Controls
Host reads the Observability global refresh interval but ignores the time window - values are always live, with rolling history retained by the dedicated SystemMetricsRingBuffer. No tab-specific controls.
KPI cards (fourteen)
| Card | Shows | Source |
|---|---|---|
| Heap used | Heap usage percent of max, plus absolute MB | jvm.memory.used (heap) / jvm.memory.max (heap) |
| Process CPU | Current process CPU percentage | process.cpu.usage |
| System CPU | Current host CPU percentage | system.cpu.usage |
| Load avg (1m) | 1-minute load average | system.load.average.1m |
| Threads (live) | Currently alive JVM threads | jvm.threads.live |
| Uptime | Process uptime, human-formatted | process.uptime |
| Classes loaded | Currently loaded class count (also surfaces unloaded total) | jvm.classes.loaded / jvm.classes.unloaded |
| Open file descriptors | Current open FDs vs max | process.files.open / process.files.max |
| Disk free | Disk free / disk total | disk.free / disk.total |
| GC overhead | Percentage of wall time spent in GC | Derived from jvm.gc.pause sum vs uptime |
| Total GC pause | Cumulative GC pause duration | jvm.gc.pause sum |
| GC count (lifetime) | Cumulative GC count across generations | jvm.gc.pause count |
| Process CPU time (cum.) | Cumulative CPU time consumed by the process | process.cpu.time |
| Buffer pools | Summary of direct / mapped buffer pool usage | jvm.buffer.memory.used and jvm.buffer.count |
Charts (nine)
| Chart | Type | Reading |
|---|---|---|
| Heap usage over time | Rolling line (MB) | Climbing without GC drops → leak suspicion |
| CPU usage over time | Multi-line (process + system) | Process tracks workload; system spikes hint at neighbour processes |
| Threads over time | Rolling line | Spikes correlate with concurrent workload bursts |
| GC activity over time | Bar (count) + line (pause) | Sustained pause time growing → tune GC or reduce allocation |
| Threads by state | Donut (RUNNABLE / WAITING / BLOCKED / …) | High BLOCKED → contention; high WAITING → idle pools |
| Heap pool usage | Horizontal bar (Eden / Old Gen / Survivor / …) | Old Gen growing without recovery → suspect long-lived leak |
| Heap retention after GC (%) | Horizontal bar | High retention after a Full GC → strong leak signal |
| GC concurrent phase time | Horizontal bar (G1 background phases) | Long concurrent phases → fragmentation pressure |
| Buffer pool used vs capacity | Horizontal stacked bar | Direct buffers high → NIO-heavy workloads (e.g. HTTP transports) |
Cross-references
- Observability Architecture → Parallel pipeline for system metrics - design rationale for the separate pipeline
- Web Application - sibling tab for HTTP / Tomcat / session / logback gauges (also from
MeterRegistrybut live-read)