spring-ai-playground
title: Web Application description: Servlet container, HTTP traffic, log-level counts, and live Spring AI in-flight operations - direct MeterRegistry reads of operational traffic signals.
Web Application
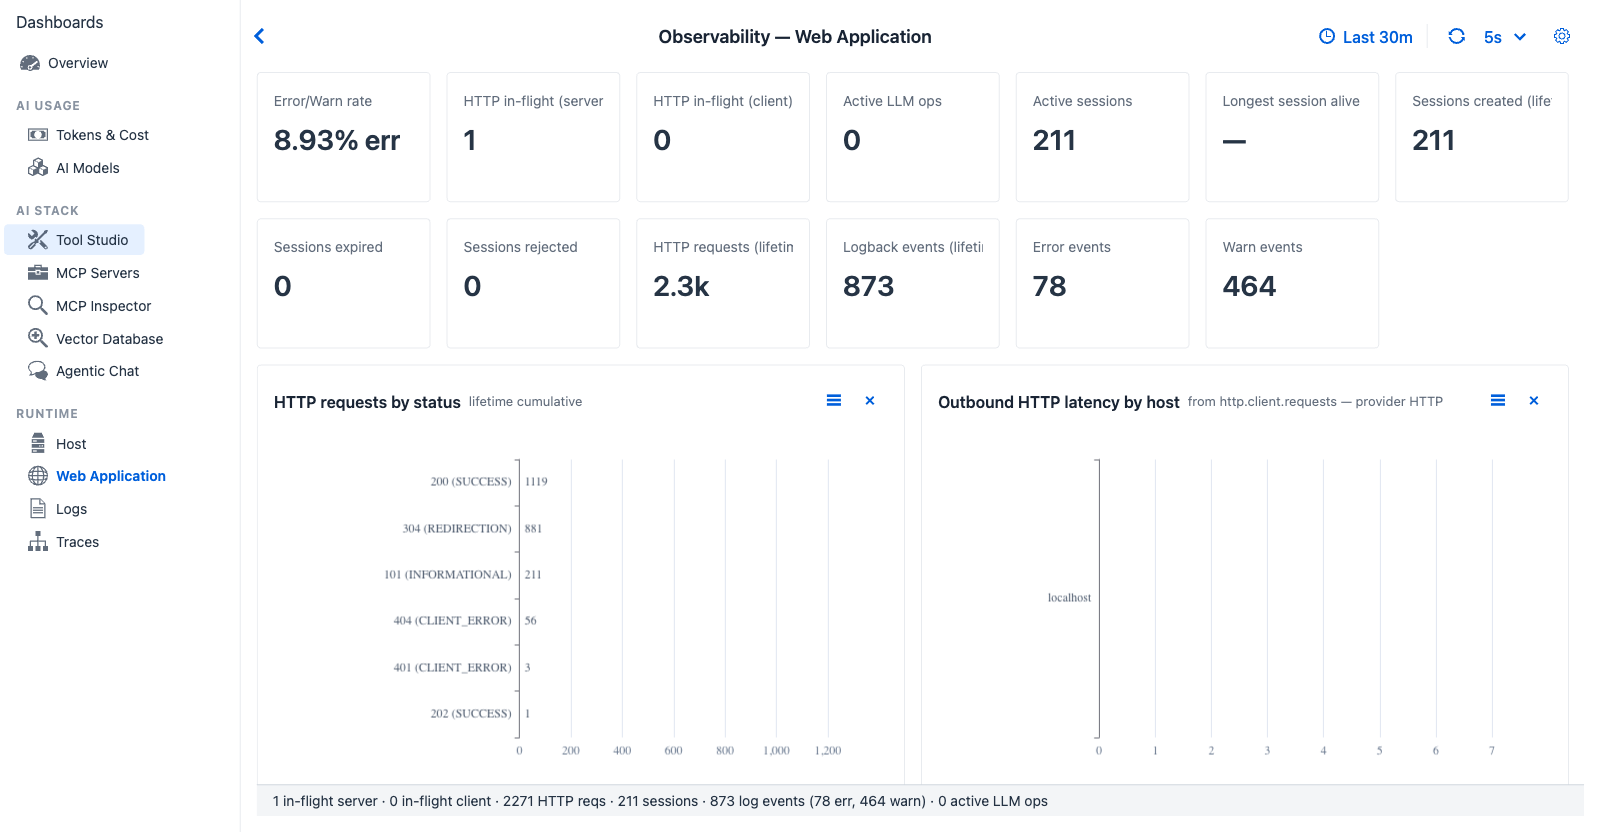
Web Application - direct MeterRegistry read (no historization through SystemMetricsCollector). The Active LLM ops gauge tracks in-flight ChatClient / Advisor / VectorStore operations as the agent runs.
Purpose - Servlet container, HTTP traffic, logback level counts, and live Spring AI in-flight operations. Different from Host because these metrics are operational traffic signals (rate, in-flight counts, status distribution), not resource consumption.
When to look here
- “Is something blocking HTTP threads?” - HTTP in-flight (server) gauge climbing without proportional throughput.
- “How many concurrent provider calls are in flight right now?” - HTTP in-flight (client) - outbound HTTP to model providers.
- “How many LLM operations are running this second?” - Active LLM ops gauge (ChatClient + Advisor + VectorStore active LongTaskTimers).
- “Are sessions piling up?” - Active sessions + Longest session alive.
- “Did we hit a wave of 4xx / 5xx responses?” - HTTP requests by status chart.
- “Is the WARN/ERROR rate climbing?” - Warn / Error event KPIs + Logback events chart.
Data source
Direct MeterRegistry read (no parallel pipeline - values are live-instant, not historized through SystemMetricsCollector).
Controls
Web Application reads the Observability global refresh interval and ignores the time window - gauges are live, counters are lifetime-cumulative. No tab-specific controls.
KPI cards (thirteen)
| Card | Shows | Source |
|---|---|---|
| HTTP in-flight (server) | Servlet requests currently being handled | tomcat.threads.busy or LongTaskTimer active count |
| HTTP in-flight (client) | Outbound HTTP requests in flight (to model providers, MCP servers) | http.client.requests active LongTaskTimer |
| Active LLM ops | In-flight Spring AI operations | Active LongTaskTimers for chatClient, advisor, vectorStore |
| Active sessions | Currently active Tomcat sessions | tomcat.sessions.active.current |
| Longest session alive | Longest-lived active session age | tomcat.sessions.alive.max |
| Sessions created (lifetime) | Cumulative session create count | tomcat.sessions.created |
| Sessions expired | Cumulative session expiry count | tomcat.sessions.expired |
| Sessions rejected | Cumulative session rejection count | tomcat.sessions.rejected |
| HTTP requests (lifetime) | Cumulative HTTP request count | http.server.requests count |
| Logback events (lifetime) | Cumulative logback events across all levels | logback.events count |
| Error events | Cumulative ERROR-level logback events | logback.events{level=ERROR} |
| Warn events | Cumulative WARN-level logback events | logback.events{level=WARN} |
| Error/Warn rate | Combined ERROR+WARN rate per minute | Derived from above counters |
Charts (four)
| Chart | Type | Reading |
|---|---|---|
| HTTP requests by status | Horizontal bar (2xx / 3xx / 4xx / 5xx, lifetime) | Sudden 4xx spike → bad request pattern; 5xx → server-side regression |
| Outbound HTTP latency by host | Horizontal bar (ms by host) | The provider hosts your agent talks to most - useful for diagnosing slow providers |
| Logback events | Horizontal bar by level (lifetime) | Disproportionate ERROR/WARN → check Logs tab for context |
| Active LLM operations | Horizontal bar by operation type (ChatClient / Advisor / VectorStore) | Long-running operation types indicate where the agent is currently blocked |
Cross-references
- Host - sibling tab for resource consumption (heap / GC / threads / disk)
- Logs - drill into individual log lines when Warn / Error KPI climbs
- Observability Architecture → External export → Metrics - same
MeterRegistryis scraped by Prometheus at/actuator/prometheus